Exporting MyIQ Reports gives you the ability to work with them offline in an excel format. This is particularly useful for reports like Supplier Score card which have a lot of data. They are exported with filters attached. You can also Export out the Weekly & Monthly Sales Target Data.
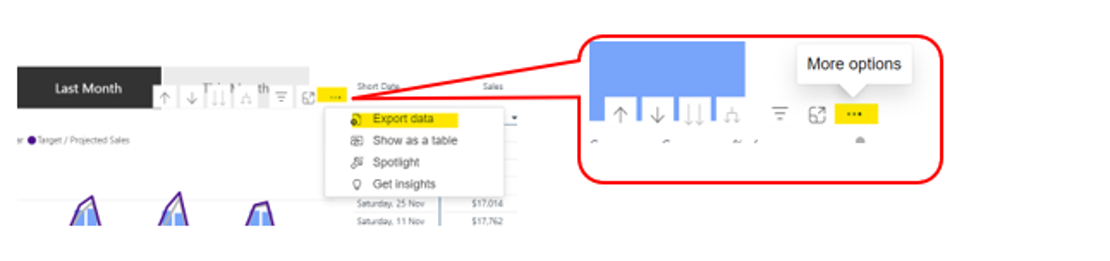
Start by looking for where the Filters are in the report, select the three dots and Export data.
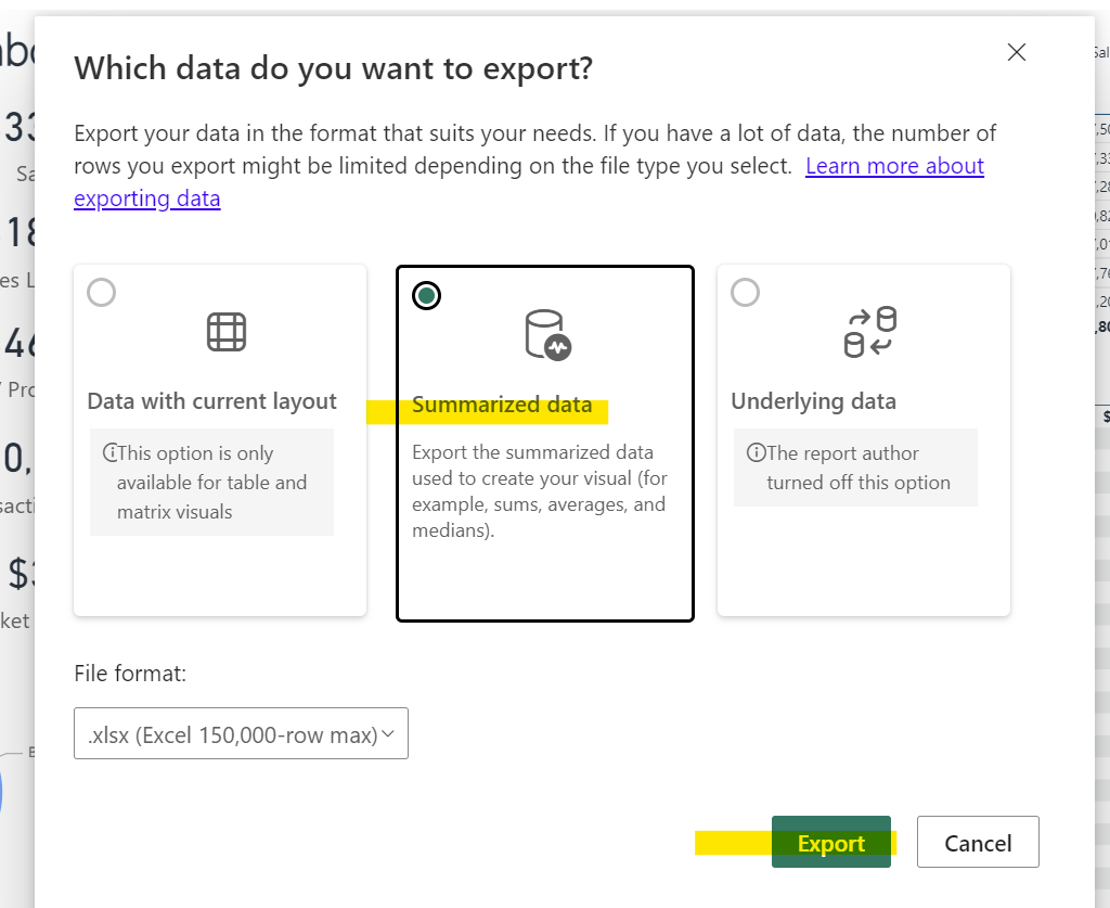
Select Summarized data and then the Export button.
Example 1 below shows the Supplier Score card exported and filtered by a Supplier:
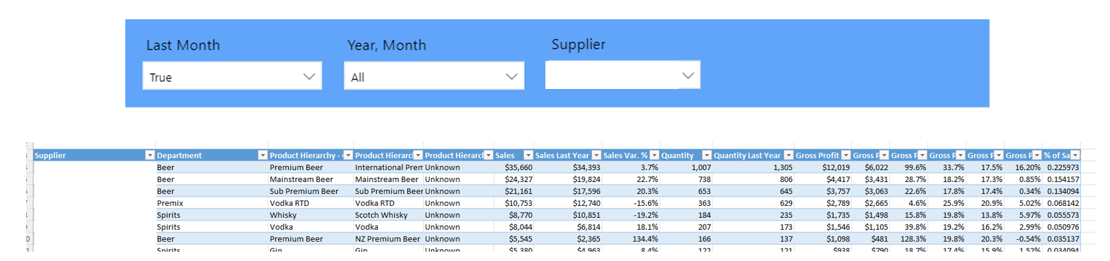
Once you have your data in Excel format you can filter it how you wish. The drop-down boxes on each column will let you re-order or filter the column to analyse.
e.g. 1. To filter to Beer Department only - start by clicking on drop-down arrow in the Department column and click on the box by (Select All) to remove ticks in all Departments. Then click in Beer so it is ticked, Click OK.
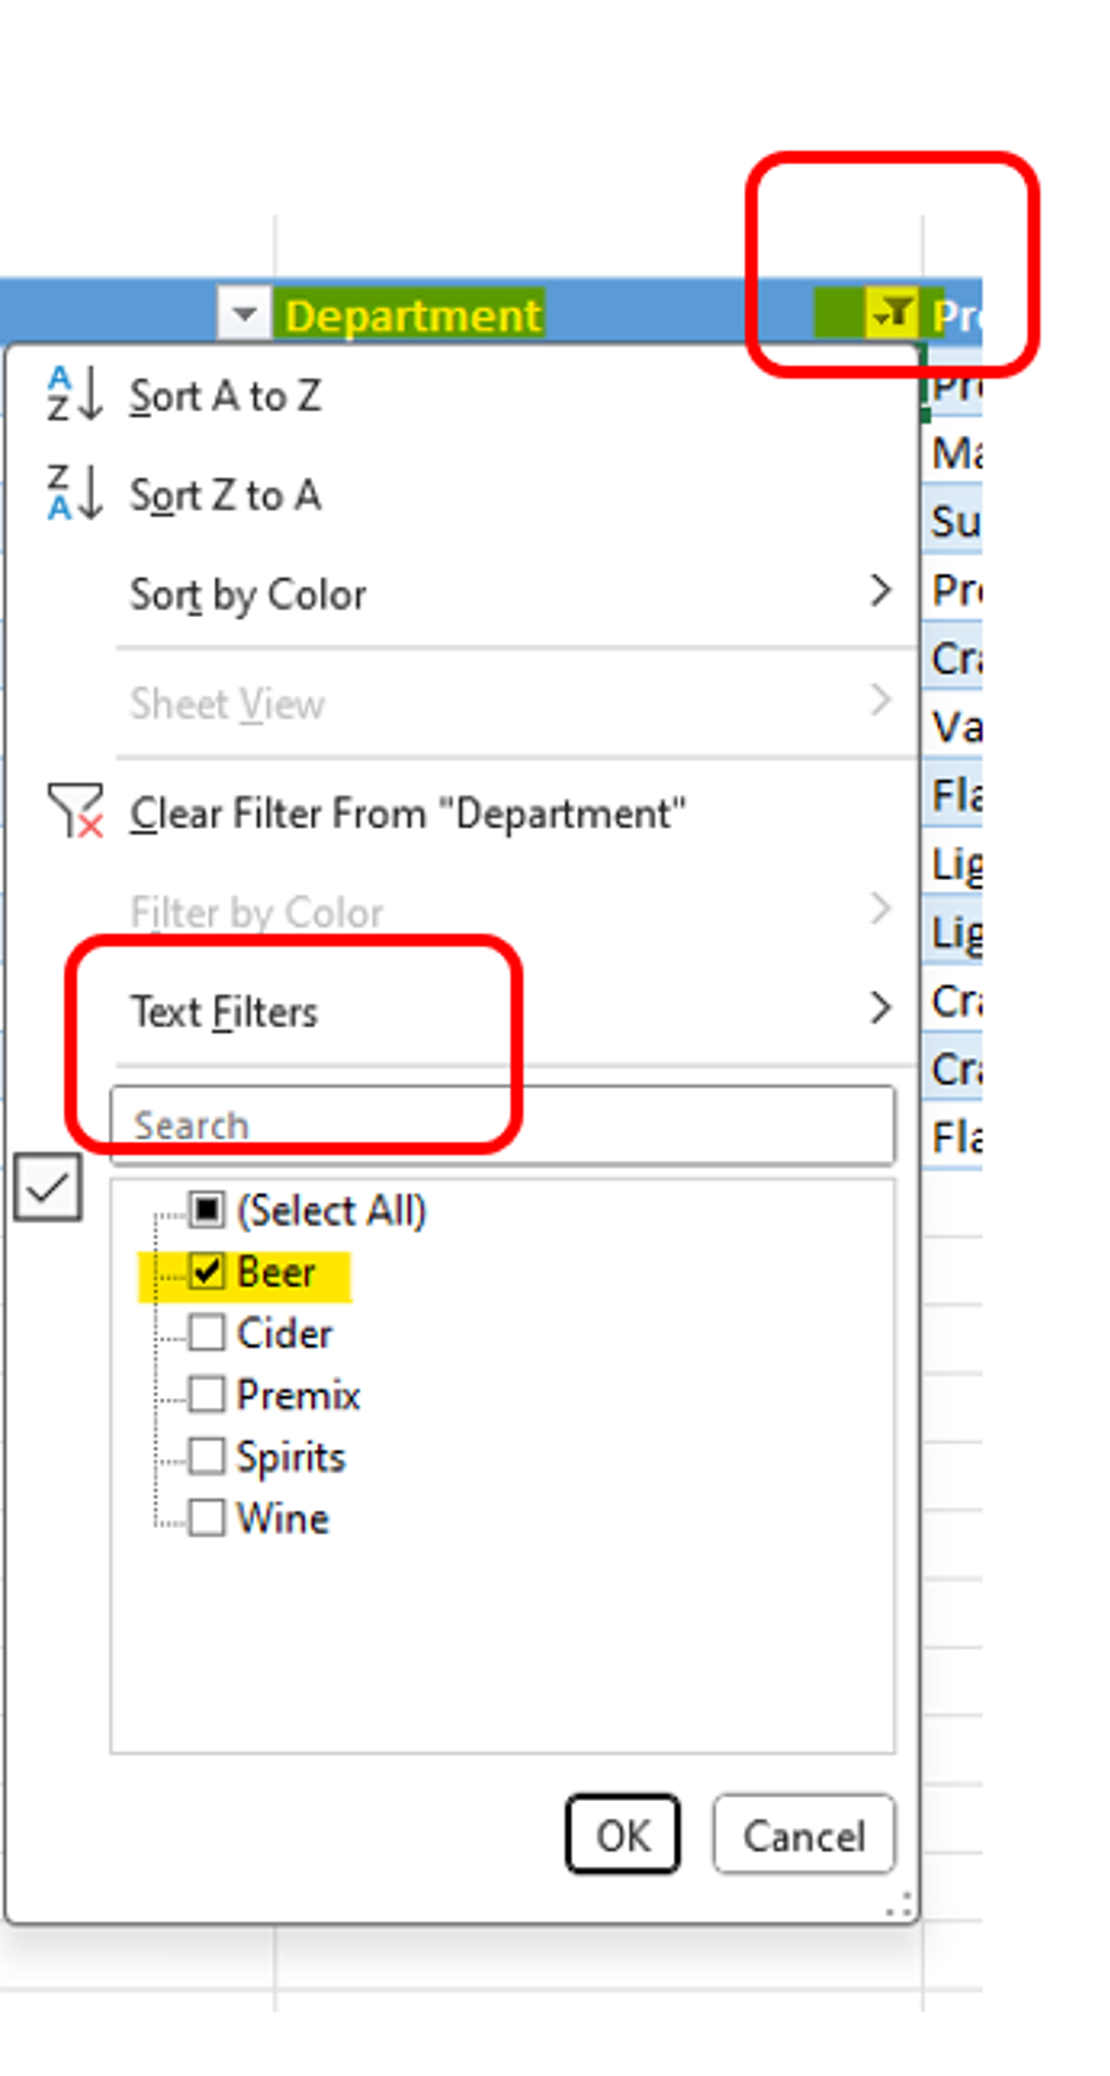
- The above filters display your sheet as Beer only, from here you can use other filters to further drill down or re-order the columns to analyse the information in smaller pieces.