Labour is the largest controllable cost in most sites, and MyIQ carries wage figures through almost every report. This section explains what those figures mean, where to find them, and how to read them without being misled.
5.1 The labour measures explained
These terms appear across the whole suite. They mean the same thing everywhere.
| Measure | What it means |
|---|---|
| Wage Cost | What the hours actually worked cost. This is accrual-adjusted, meaning it includes accrued entitlements such as holiday pay — it is not simply hours multiplied by the hourly rate, and it will be higher than a raw payroll hours figure. |
| Wage % | Wage Cost as a percentage of sales. The headline labour productivity measure. |
| Rostered Wage Cost | What the published roster was going to cost. Known before the shift is worked. |
| Rostered Wage % | Rostered Wage Cost measured against target or projected sales — what the roster was planned to cost as a share of the sales it was built for. |
| Actual / Rostered Wage Cost | A single column that shows actual cost for days already worked and rostered cost for days still to come, so a part-finished week still totals sensibly. |
| Budget Wage Cost | The wage target loaded for the period. Set by your organisation, not calculated by MyIQ. |
| Wage Cost Variance | The gap between actual and rostered wage cost. Negative means you spent less than you rostered. |
| Budget Wage Cost Var. % | The gap between actual wage cost and the budget, as a percentage. |
| Hours Worked | Paid hours on the floor, taken from timesheets. |
| Sales Per Labour Hour | Sales divided by hours worked, excluding annual leave and sick leave hours. Leave is paid but nobody was on the floor, so including it would understate productivity. This is the fair way to compare sites of different sizes and opening hours. |
| Contribution Margin | Gross profit after wage cost — what the site contributed once the people who sold it were paid for. |
| Wage Cost – FOH / Kitchen | The departmental split. Hospitality sites split front of house from kitchen; retail sites use their own departments. Which departments you see depends on how your sites are configured. |
5.2 Where wage figures appear
You do not have to open a wage report to see labour figures. They are built into the trading reports as well.
| Report | What it gives you |
|---|---|
| Daily Dashboard | Wage % by department in the KPI strip, and Actual Wage Cost as a line on the hourly sales chart. |
| Daily Report | A full wages table by department with cost, percentage, target and the gap in dollars. |
| Weekly / Monthly Dashboard | Actual / Rostered Wage Cost and Wage % per day in the period table. |
| Weekly Summary Dashboards | Wage Cost, Wage Cost % of Sales, Budget Wage Cost and the budget variance for every site. |
| Weekly P&L | Wage cost by department, wage percentages and Contribution Margin per site. |
| Plan vs Actual | Actual / Rostered Wage Cost as a line against target sales, plus budget wage cost by department. |
| Daily Wage Costs | The week in detail — actual against rostered against budget, day by day. |
| Hourly Wage Costs | The shape of labour through the day, against the shape of sales. |
| Wage Cost by Store | Every site side by side for a month. |
| Timesheets | The individual shifts behind all of the above. |
5.3 Daily Wage Costs
Answers: How is labour tracking this week, day by day, against roster and budget?
Use it when: planning or reviewing a week. The Next Week button makes this the report for checking a roster before it is worked.
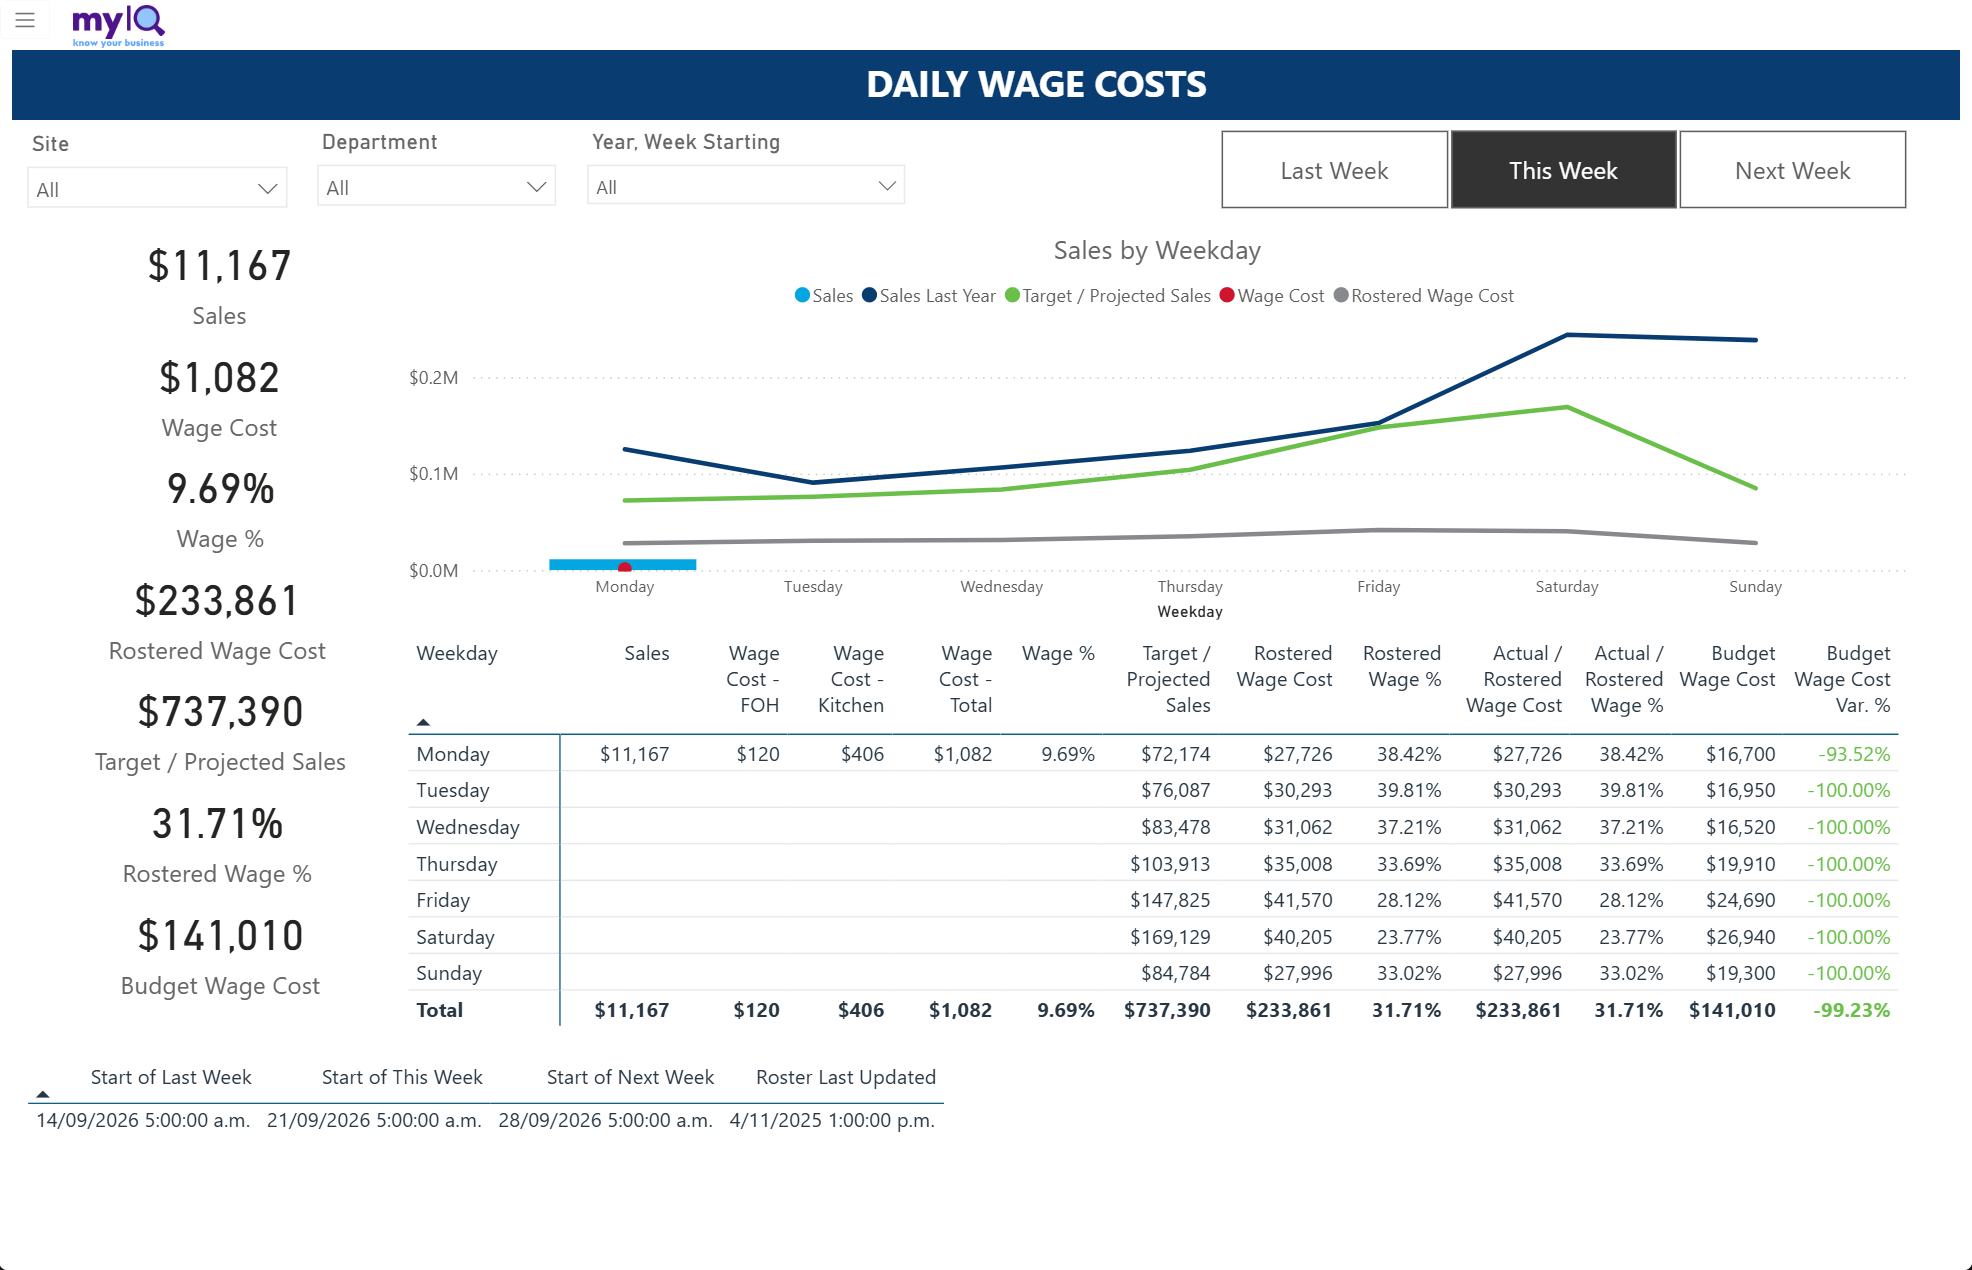
Daily Wage Costs, showing a week that has only just started.
Filters: Site, Department, Year & Week Starting, and Last Week / This Week / Next Week buttons.
What is on the page
A KPI strip: Sales, Wage Cost, Wage %, Rostered Wage Cost, Target / Projected Sales, Rostered Wage % and Budget Wage Cost.
A Sales by Weekday chart with lines for Sales, Sales Last Year, Target / Projected Sales, Wage Cost and Rostered Wage Cost.
A weekday table carrying the full set: Sales, Wage Cost by department and in total, Wage %, Target / Projected Sales, Rostered Wage Cost and Rostered Wage %, Actual / Rostered Wage Cost and %, Budget Wage Cost, and Budget Wage Cost Var. %.
Footer stamps for the start of last, this and next week, and — importantly — when the roster was last updated.
How to read it
Compare Wage % against Rostered Wage % on the same row. If actual is running above rostered, the shift cost more than planned — overtime, a late finish, or extra cover.
Compare Rostered Wage % against your target percentage before the week starts. If the roster is already above target on Saturday, no amount of good management on the day will fix it.
On the chart, the grey rostered line should follow the shape of the sales and target lines. Where it stays flat while sales fall away, the roster is not flexed to trade.
Check the Roster Last Updated stamp. A stale roster makes every rostered figure on the page unreliable.
Reading a part-finished week
In the screenshot above, the week started on Monday and the capture was taken mid-morning. Only Monday has any actual wage cost, so:
Wage % reads 9.69% while Rostered Wage % reads 31.71% — the first covers a few hours, the second covers the whole week.
Budget Wage Cost Var. % reads −100.00% in green for every day that has not happened yet. That is not an under-spend; it means there is no actual cost to compare against the budget.
Only read variance columns for days that have finished.
5.4 Hourly Wage Costs
Answers: Does our labour curve match our sales curve?
Use it when: building or challenging a roster, or working out where to add and cut hours.
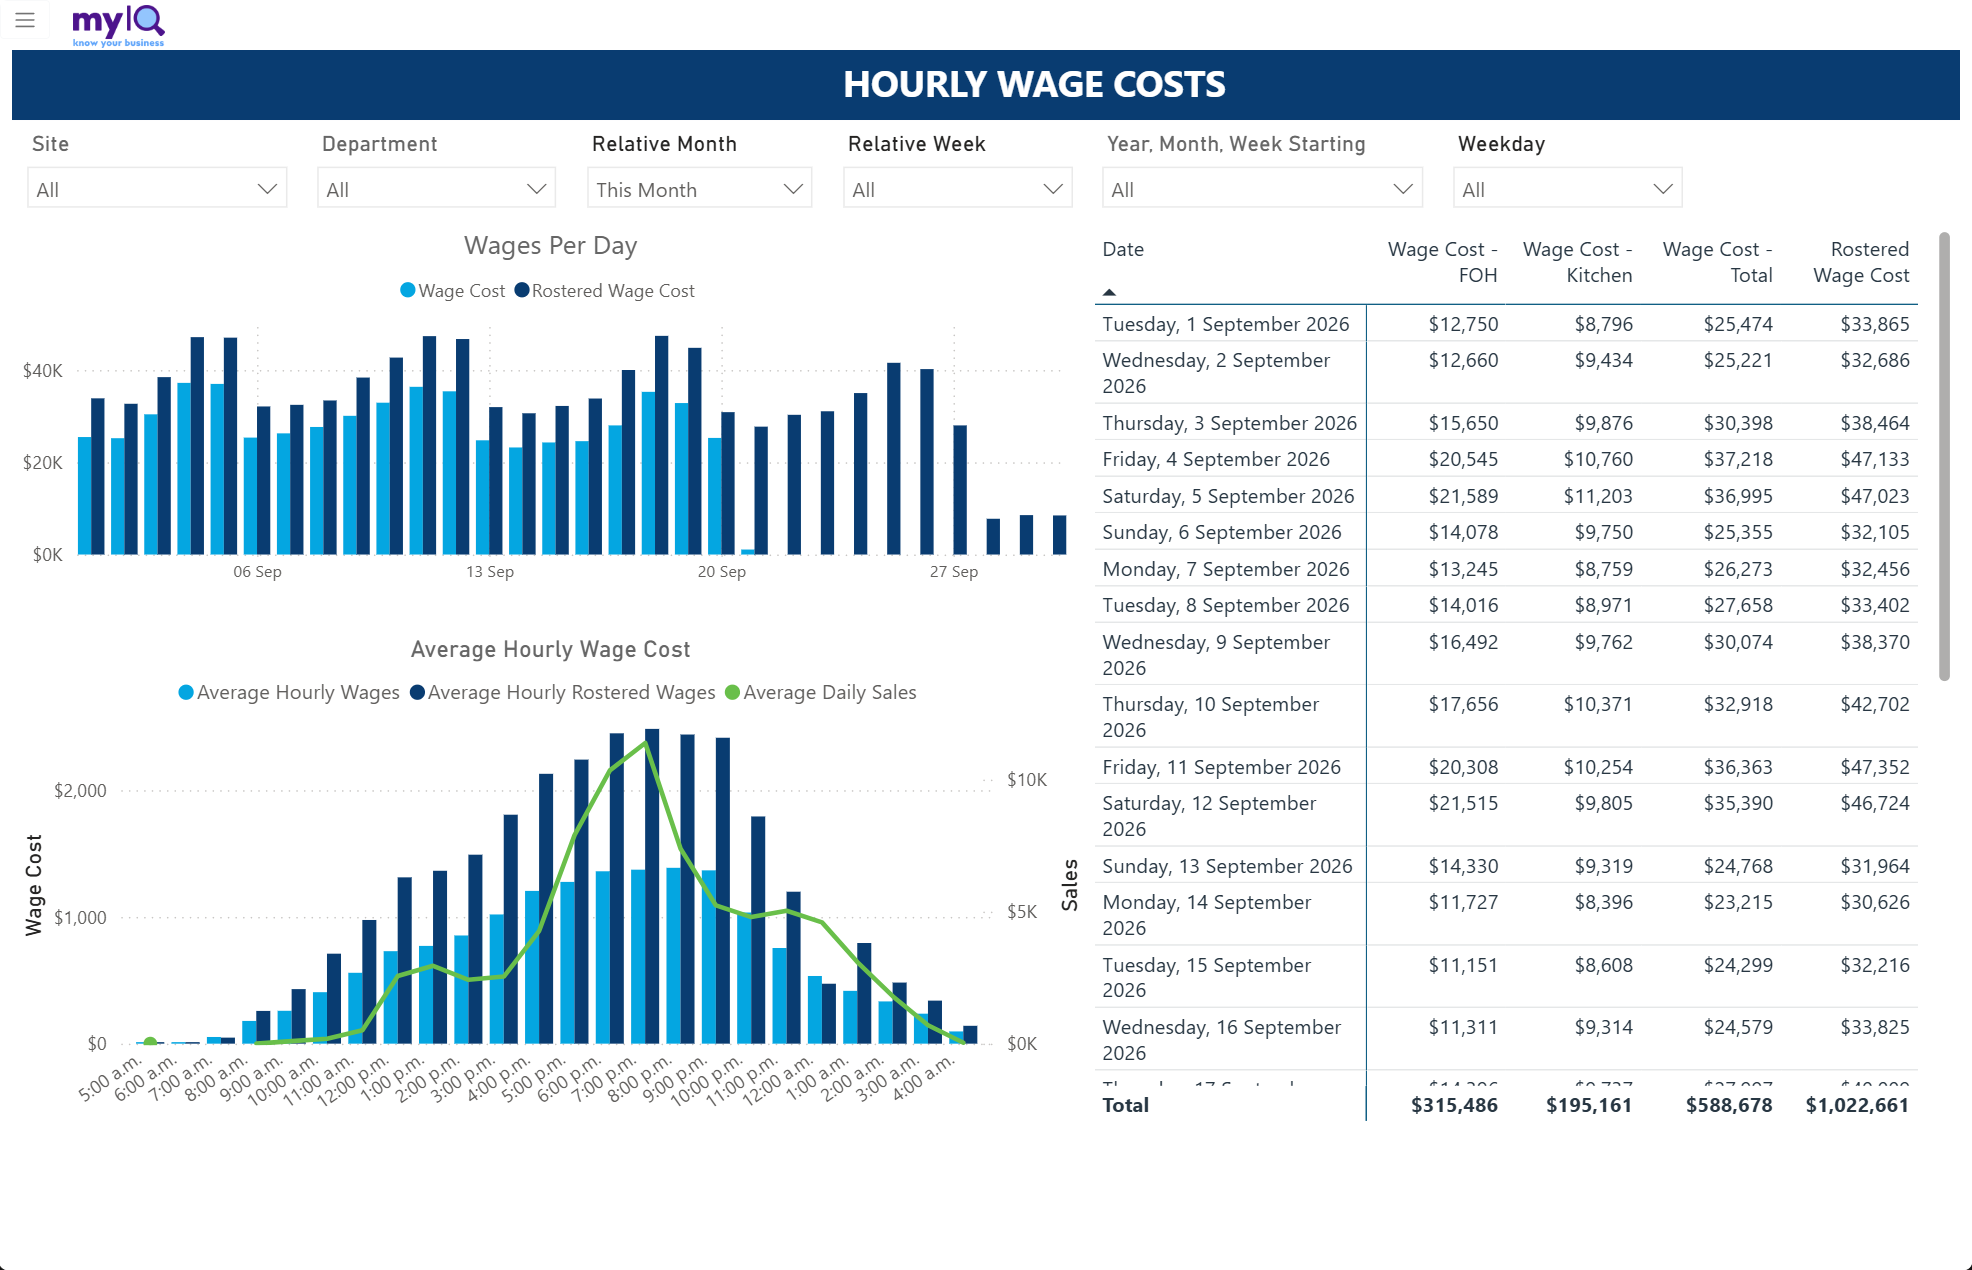
Hourly Wage Costs. The lower chart is the one that drives rostering decisions.
Filters: Site, Department, Relative Month, Relative Week, Year & Month & Week Starting, Weekday.
What is on the page
Wages Per Day — a column chart pairing actual Wage Cost against Rostered Wage Cost for each day in the period.
Average Hourly Wage Cost — Average Hourly Wages and Average Hourly Rostered Wages as columns, with Average Daily Sales as a line on a second axis.
A date table with Wage Cost by department, Wage Cost Total and Rostered Wage Cost.
How to read it
The lower chart is the important one. The green Average Daily Sales line is when money comes in; the columns are when you are paying for people. Where the columns run ahead of the line, you are paying for hours before the trade arrives.
In the demo, wages build from mid-afternoon and peak around 7–8 p.m. alongside sales, then stay high into the late evening after sales have fallen away — the classic close-down overhang.
Use the Weekday slicer to look at a single day of the week. The all-days average hides the fact that Friday and Tuesday need completely different rosters.
In the upper chart, days where the dark rostered column towers over the pale actual column are days the roster was cut back on the day, or where hours were not worked as planned.
5.5 Wage Cost by Store
Answers: Which sites are running efficient labour, and which are not?
Use it when: reviewing a completed month across a group.
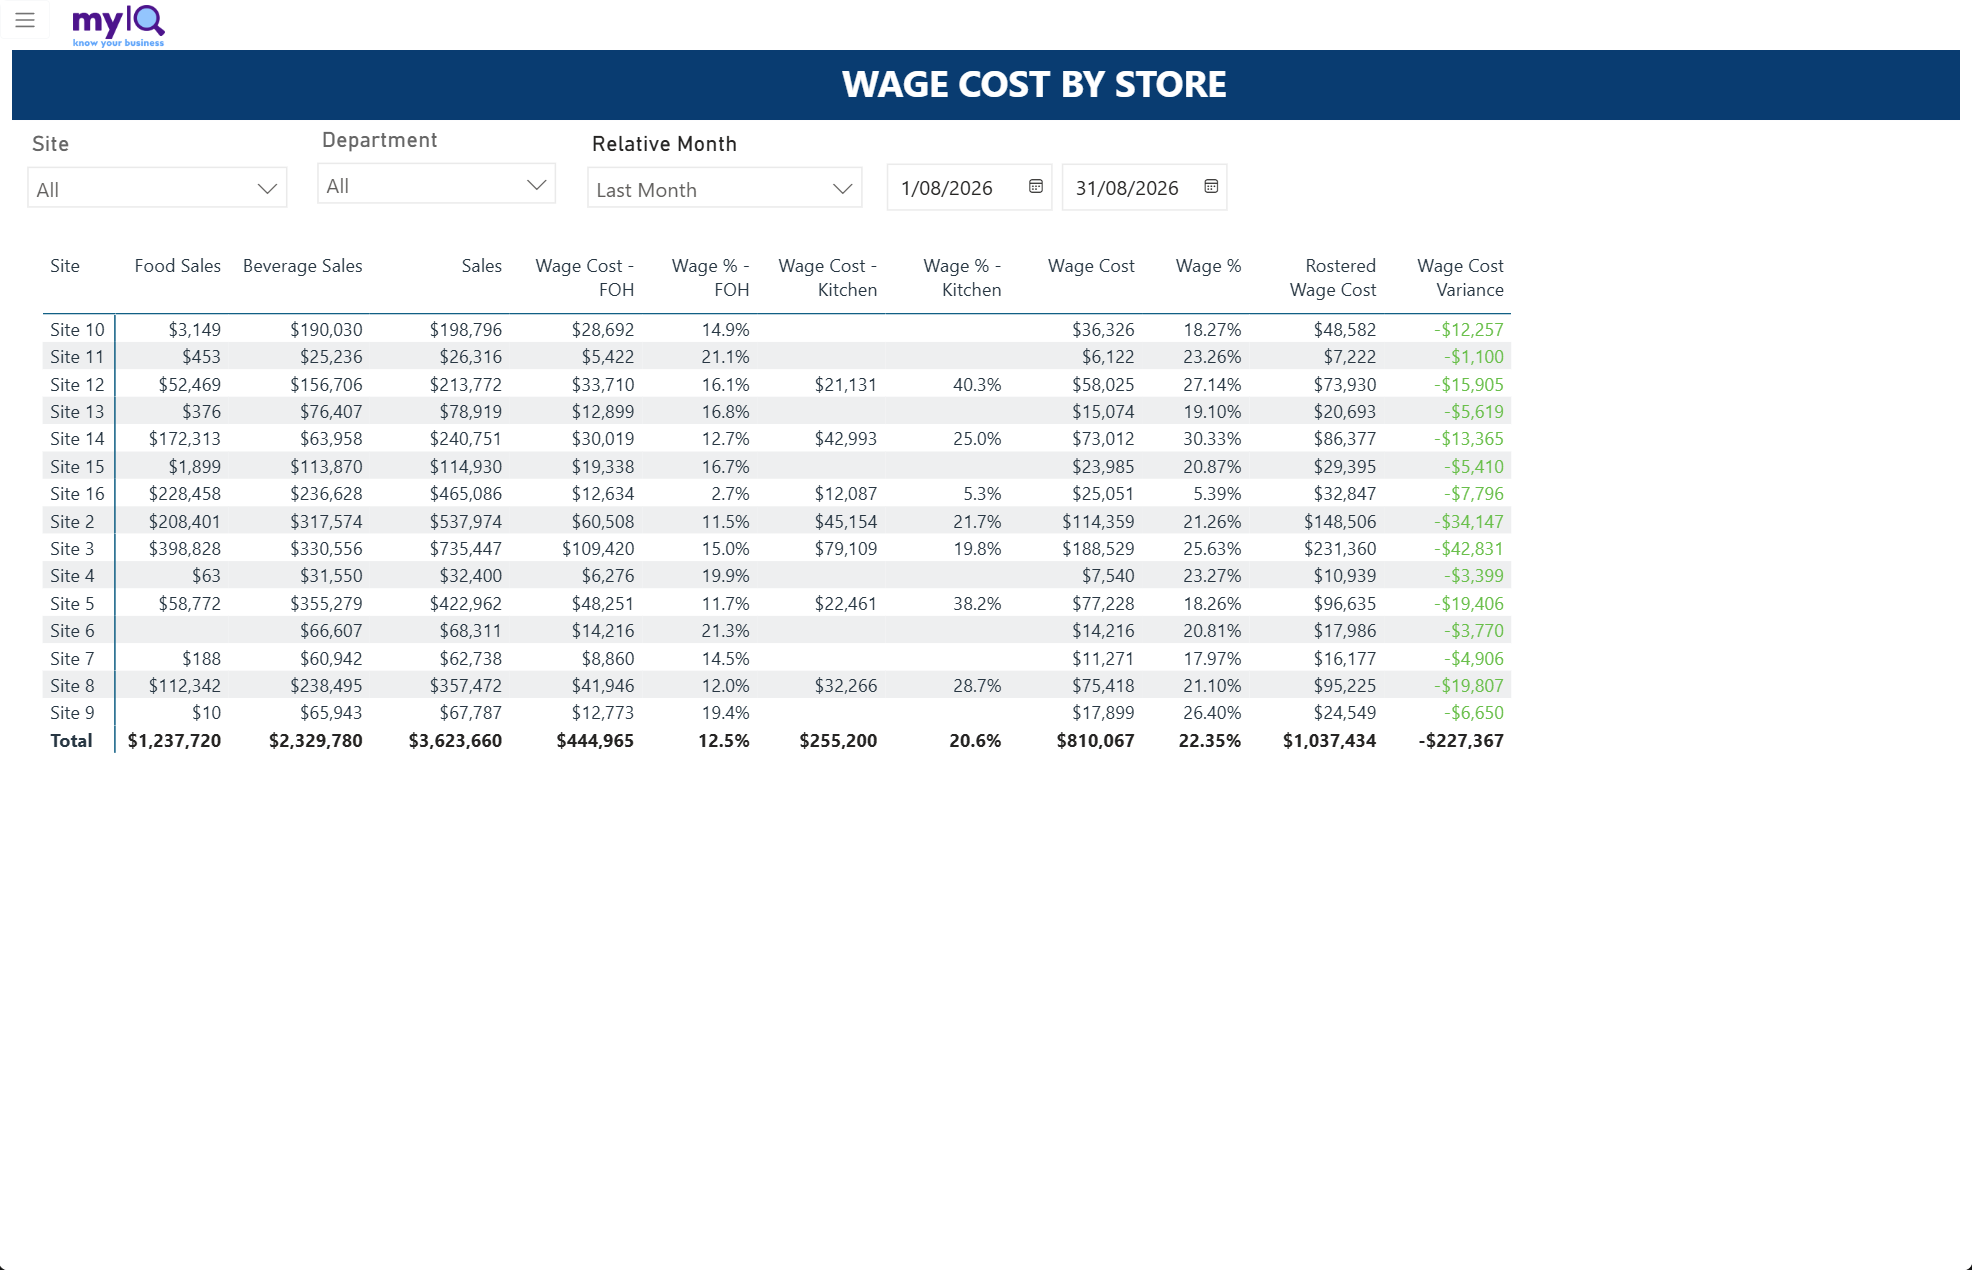
Wage Cost by Store, comparing every site for a month.
Filters: Site, Department, Relative Month with a date range.
What is on the page
A single site-by-site table: Food Sales, Beverage Sales, Sales, Wage Cost and Wage % by department, total Wage Cost and Wage %, Rostered Wage Cost, and Wage Cost Variance.
How to read it
Sort by Wage % descending to rank sites from least to most efficient. Click the column heading once, then again to reverse.
Read the departmental percentages before drawing conclusions from the total. A site with a high overall wage percentage and a normal FOH percentage has a kitchen problem, not a service problem.
A negative Wage Cost Variance means the site spent less than it rostered. Consistently large negative variances suggest the roster is being built too generously, not that the site is being frugal.
Compare sites of similar size and type. A small site will always show a higher wage percentage than a large one, because a minimum staffing level is spread over less trade.
5.6 Timesheets
Answers: Who worked, when, for how long, and at what cost?
Use it when: a wage figure needs explaining, or a payroll query needs checking.
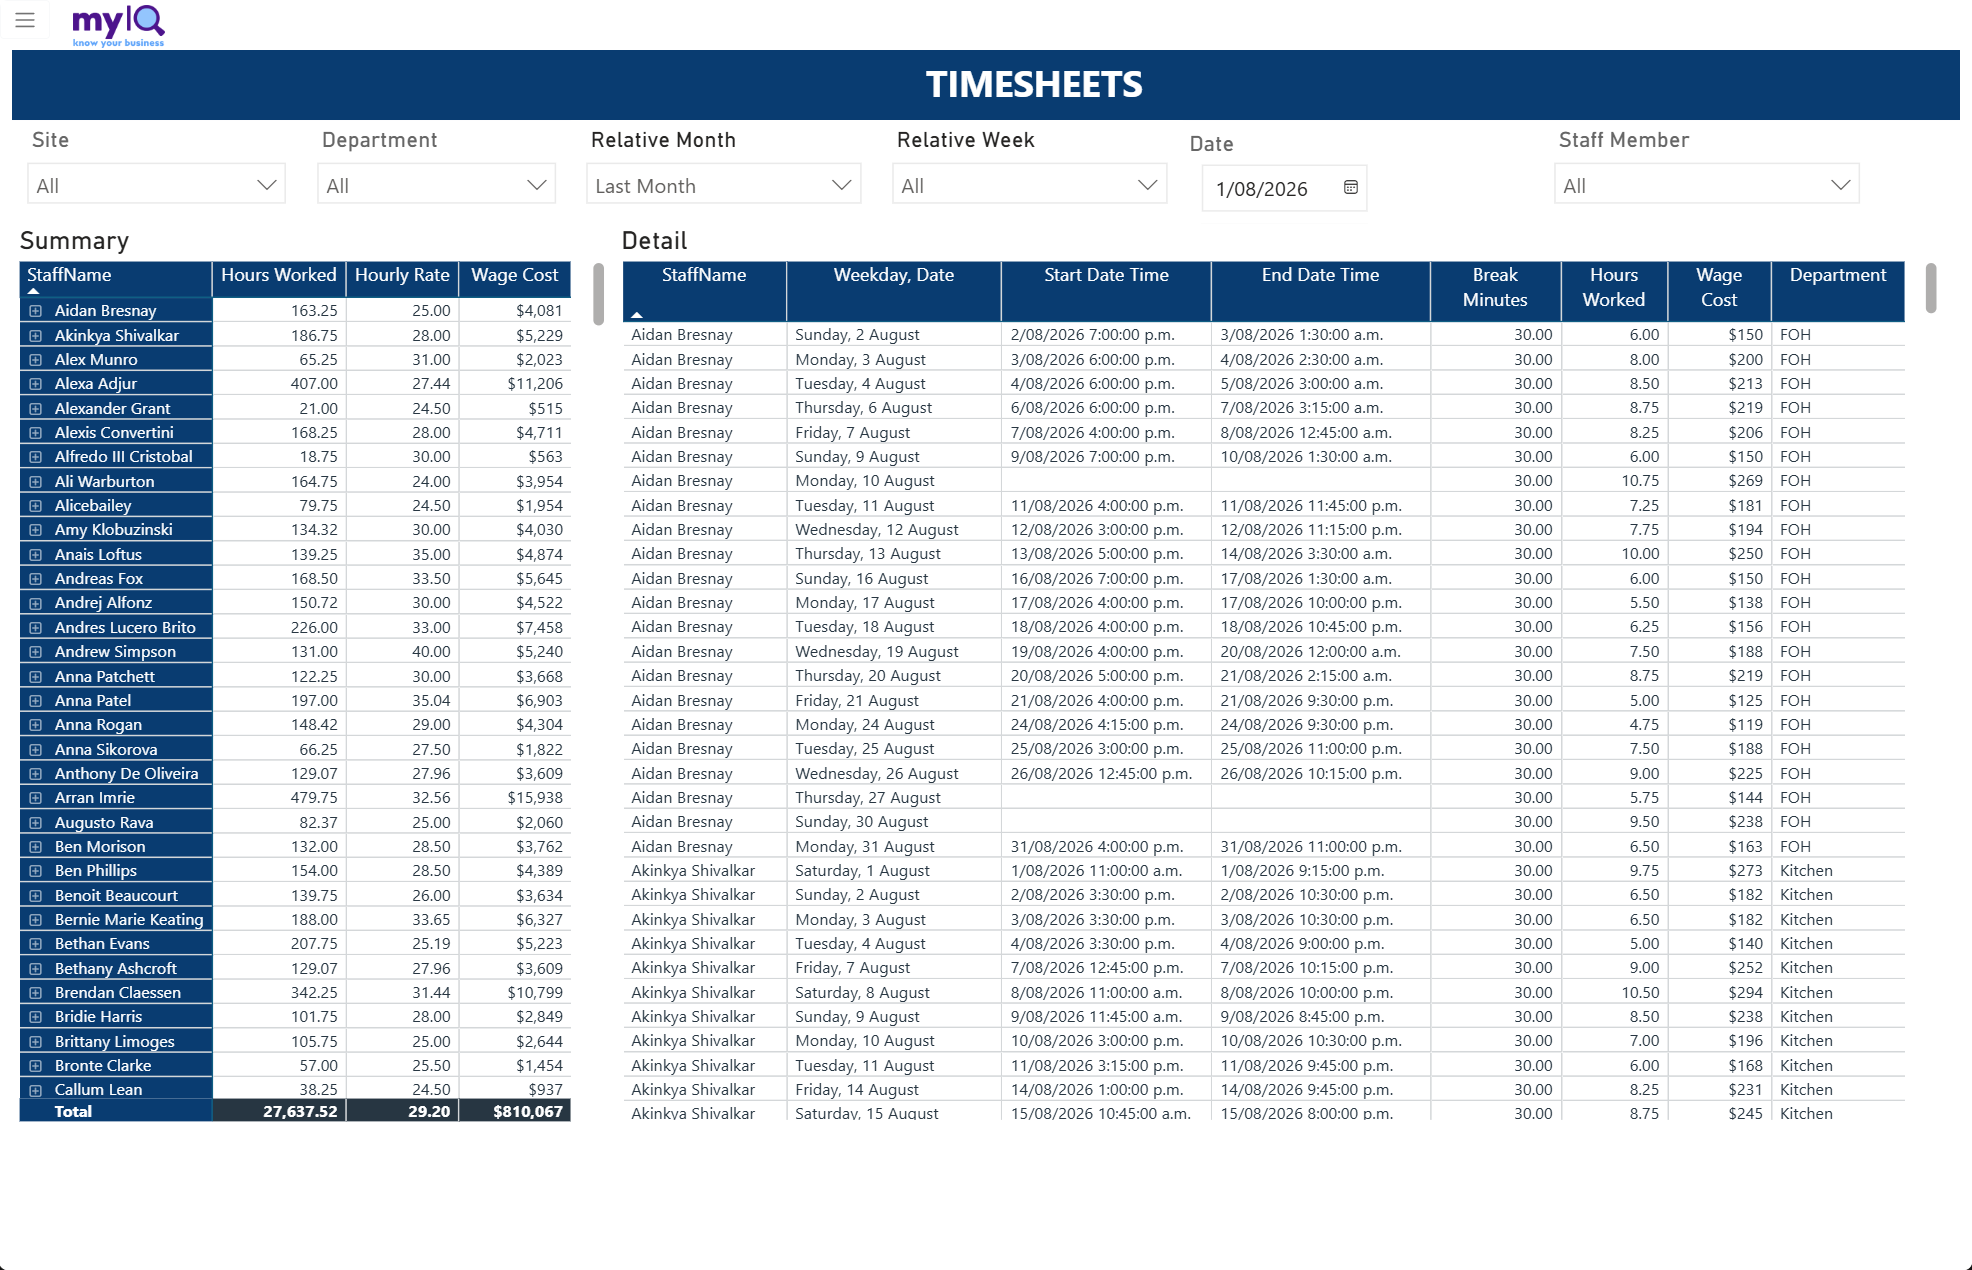
Timesheets — the summary by staff member on the left, the shift-by-shift detail on the right.
Filters: Site, Department, Relative Month, Relative Week, Date, Staff Member.
What is on the page
A Summary table: each staff member with Hours Worked, Hourly Rate and Wage Cost, expandable for detail.
A Detail table: every shift with the staff member, weekday and date, start and end date-time, break minutes, hours worked, wage cost and department.
How to read it
Click a name in the Summary table and the Detail table filters to that person, which is how you answer a "why is my pay short" question in about thirty seconds.
Shifts that run past midnight show an end date-time on the following calendar day. That is correct and does not double-count.
A detail row with hours worked but no start and end time is a manual adjustment rather than a clocked shift.
This is the report to export when someone needs the working. See section 3.14.
5.7 Reading wage variances correctly
Most wage figures that look wrong are being read at the wrong moment in the period. These four rules cover nearly all of it.
| Rule | Why |
|---|---|
| Only read variances for finished days | A day that has not been worked has no actual wage cost, so every variance against it reads as a full shortfall — usually −100%, and coloured green as though it were good news. |
| Know whether you are looking at actual or rostered | Columns headed "Actual / Rostered" switch from one to the other as days are worked. In a part-finished week the same column contains both. |
| Wage % needs sales to be meaningful | It is a ratio. Early in a trading day the denominator is tiny, so the percentage is enormous. This is arithmetic, not a labour blow-out. |
| Rostered percentages are measured against target sales | Rostered Wage % divides rostered cost by target or projected sales, not by actual sales. If sales miss target, your actual wage percentage will land above the rostered figure even when the roster was worked exactly as planned. |
5.8 Common wage questions
| Question | Answer |
|---|---|
| Why is wage cost higher than the hours times the rate? | Wage Cost is accrual-adjusted — it includes accrued entitlements such as holiday pay. A raw hours-by-rate calculation will always be lower. |
| Why does Sales Per Labour Hour not match my own calculation? | It excludes annual leave and sick leave hours from the denominator, because those hours are paid but nobody was on the floor. |
| Wage % looks fine but the site is not making money. | Look at Contribution Margin on the Weekly P&L instead. A site can hold its labour percentage and still fail on margin. |
| The rostered figures look wrong. | Check the Roster Last Updated stamp at the bottom of Daily Wage Costs. If the roster has not been published or updated, MyIQ is reporting an old plan faithfully. |
| Two departments, one number. | The Department slicer at the top of the wage reports filters everything on the page. Make sure it is set to All when you want the whole site. |
| Can I see wage cost by hour of the day? | Yes — the Average Hourly Wage Cost chart on Hourly Wage Costs. For a specific day rather than an average, set the Weekday slicer. |